Package for the AMQA data management team. Contains functions for the common data cleaning & wrangling steps the team comes across.
Installation
You can install the development version of akairmonitorr from GitHub with:
# install.packages("pak")
pak::pak("simeon-s-ng/akairmonitorr")
OR
# install.packages("devtools")
devtools::install_github("simeon-s-ng/akairmonitorr")
Example
You can query our internal AirVision server for data with:
(I recommend storing & using your API key in R with the Keyring package)
key <- API_KEY
quant_460 <- query_agileweb("Quant_MOD00460", "PM25", start = "2024-05-13T00:00:00", api_key = key) |>
  clean_pm25()
NOTE: To obtain an AirVision API key, you may request a key by reaching out to the AMQA Data Management Team at amqa-data-request@alaska.gov
Or read a .csv basic data export from AirVision:
file_path <- "C:/Data Analysis/Testing/data/haines_quant.csv"
haines_quant <- read_aa(file_path)
#> New names:
#> • `` -> `...1`
#> • `Quant_MOD00450` -> `Quant_MOD00450...2`
#> • `Quant_MOD00450` -> `Quant_MOD00450...3`
#> • `Quant_MOD00450` -> `Quant_MOD00450...4`
#> • `Quant_MOD00450` -> `Quant_MOD00450...5`
#> • `Quant_MOD00450` -> `Quant_MOD00450...6`
#> • `Quant_MOD00450` -> `Quant_MOD00450...7`
#> • `Quant_MOD00450` -> `Quant_MOD00450...8`
#> • `Quant_MOD00450` -> `Quant_MOD00450...9`
#> • `Quant_MOD00450` -> `Quant_MOD00450...10`

head(haines_quant)
#> # A tibble: 6 × 10
#>   date                ambtemp co_ppb co_ppm no_ppb no2_ppb ozone_ppb pm10_contin
#>   <dttm>                <dbl>  <dbl>  <dbl>  <dbl>   <dbl>     <dbl>       <dbl>
#> 1 2024-01-31 00:00:00     0.6  -42.9      0   2.41    8.61      38.3           5
#> 2 2024-01-31 01:00:00     0.5  -43.2      0   2.79    8.44      39.6           3
#> 3 2024-01-31 02:00:00     0.4  -37.2      0   2.69    9.03      40.4           2
#> 4 2024-01-31 03:00:00     0.4  -34.4      0   2.34    9.4       41.0           8
#> 5 2024-01-31 04:00:00     0.2  -32.0      0   2.42   10.2       39.8          44
#> 6 2024-01-31 05:00:00    -0.4  -13.4      0   2.37    8.62      41.8          63
#> # ℹ 2 more variables: pm25 <dbl>, relhum <dbl>
Create diurnal plots of a sensor or sensor dataset with
library(patchwork)
plot_diurnal(quant_460, "pm25", c("Quant_MOD00460"), "Your title here", "median")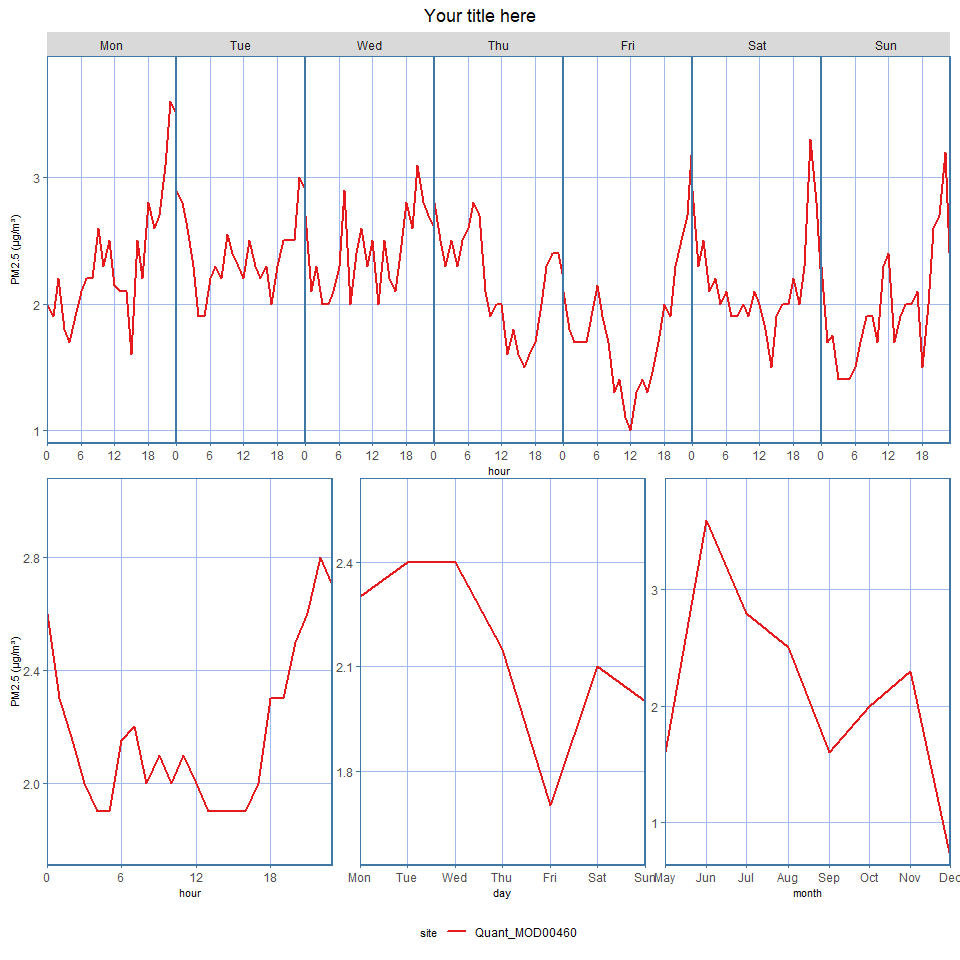
You can create an OpenAir diurnal plot with your imported data (must follow openair package column naming conventions):
# plot_quant_pm25(haines_quant, "Haines")You can create an OpenAir wind rose with your imported data (must follow openair package column naming conventions):
# plot_wind_rose(data, "Hourly Wind Speed (m/s) vs. Direction at the A Street Monitor 2021")